Vendor Scorecard: 10 Metrics to Evaluate Supplier Performance
On this page 41 sections
You've got three suppliers. One gives you the lowest price per unit. Another ships fast. The third rarely sends defective goods. Ask most business owners which supplier is best, and they'll point to the cheapest one. The invoice is right there in black and white.
But pull up the last six months of purchase orders and receiving records, and the picture gets uncomfortable. The cheap supplier shipped late four times. Two of those late shipments were also short by 15%. The fast supplier invoiced you incorrectly on three occasions, each one eating an hour of back-and-forth with your accounts payable person. The quality-focused supplier quietly raised prices twice without updating the purchase order terms.
None of these problems showed up on any single invoice. They showed up in stockouts, in rework, in margin compression, in wasted admin time.
This is exactly where a vendor scorecard earns its place.
By the end of this piece, you'll understand how to measure supplier performance using ten specific metrics, how to weight and interpret those metrics, and how to turn the results into actual purchasing decisions.
What is a vendor scorecard?
A vendor scorecard is a structured tool that quantifies supplier performance across defined metrics such as delivery, quality, cost, and service. It converts purchasing data into comparable scores, giving businesses an objective basis for evaluating, comparing, and making decisions about their suppliers over time.
That definition is the skeleton. The muscle is in what you measure, how you calculate it, and what you do with the number. A score without a data source is just an opinion with a number attached.
What does a vendor scorecard measure?
Supplier performance is not one thing. A useful scorecard spans several dimensions rather than collapsing everything into price. In practice those dimensions are cost, quality, delivery, reliability, service, compliance, and administrative accuracy. Each one is captured by one or more concrete metrics.
| Metric | What it measures | Why it matters |
|---|---|---|
| On-time delivery | Delivery reliability | Prevents delays |
| Fill rate | Order completeness | Reduces shortages |
| Defect rate | Quality | Reduces waste and returns |
| Price variance | Cost consistency | Protects margins |
Vendor scorecard vs vendor evaluation vs vendor management
These terms get used interchangeably. They shouldn't.
| Term | Purpose |
|---|---|
| Supplier selection | Decide whether to work with a supplier |
| Vendor evaluation | Assess supplier suitability or performance |
| Vendor scorecard | Quantify ongoing supplier performance with defined metrics |
| Vendor management | Manage the broader relationship |
| Supplier development | Help suppliers improve performance |
Managing a supplier relationship is one thing. Measuring it is another. If you want the relationship side, ProfitBooks has a separate guide on vendor management best practices. This article is about measurement.
Why this matters
Confusing these concepts is how businesses end up holding regular supplier meetings without ever measuring performance. They talk about the relationship, agree things feel fine, and never check whether the delivery, quality, and cost numbers back that up. A scorecard is the measurement layer the conversation is supposed to sit on.
Why should businesses measure supplier performance?
Supplier performance rarely stays in the purchasing department. It flows downstream through the whole business.
→
Purchasing
→
Inventory
→
Operations
→
Sales
→
Cash flow
→
Customer experience
Without structured measurement, supplier evaluation runs on memory and gut feeling. Recent incidents dominate. Personal relationships influence judgement. If two people in your company deal with the same supplier, they'll often give you two different assessments.
Recurring problems get normalized. "Oh, that supplier is always a bit late" becomes an accepted fact rather than a measurable cost.
With structured measurement, performance becomes visible. Trends become trackable. Supplier conversations shift from "we feel like quality has slipped" to "your defect rate increased from 2% to 5% over the last quarter." That's a different conversation entirely.
A scorecard doesn't automatically fix supplier problems. It gives you better information for decisions.
Supplier problems rarely stay with purchasing
Each supplier failure has a downstream cost that lands in a different part of the business:
Late delivery turns into a stock shortage.
Partial delivery turns into an incomplete customer order.
Defective goods turn into returns and rework.
Invoice errors turn into additional finance work.
Price changes turn into margin pressure.
A scorecard makes supplier problems visible
Once you have the data in one place, patterns that were invisible in day-to-day firefighting become obvious. A scorecard surfaces recurring delays, inconsistent quality, unexplained price increases, poor responsiveness, and repeated invoice discrepancies, all as trends rather than one-off complaints.
It creates a basis for supplier conversations
There is a difference between saying "you have been delivering late" and saying "your on-time delivery rate was 82% across the last 25 deliveries." The first is an impression the supplier can argue with. The second is a number they have to respond to. Measurement turns a vague complaint into an actionable conversation.
Why this matters
Suppliers respond to evidence, not adjectives. A documented rate gives you a specific thing to fix and a baseline to hold them to next quarter. Without it, every review is a matter of opinion, and the loudest opinion usually wins.
When does a small business need a vendor scorecard?
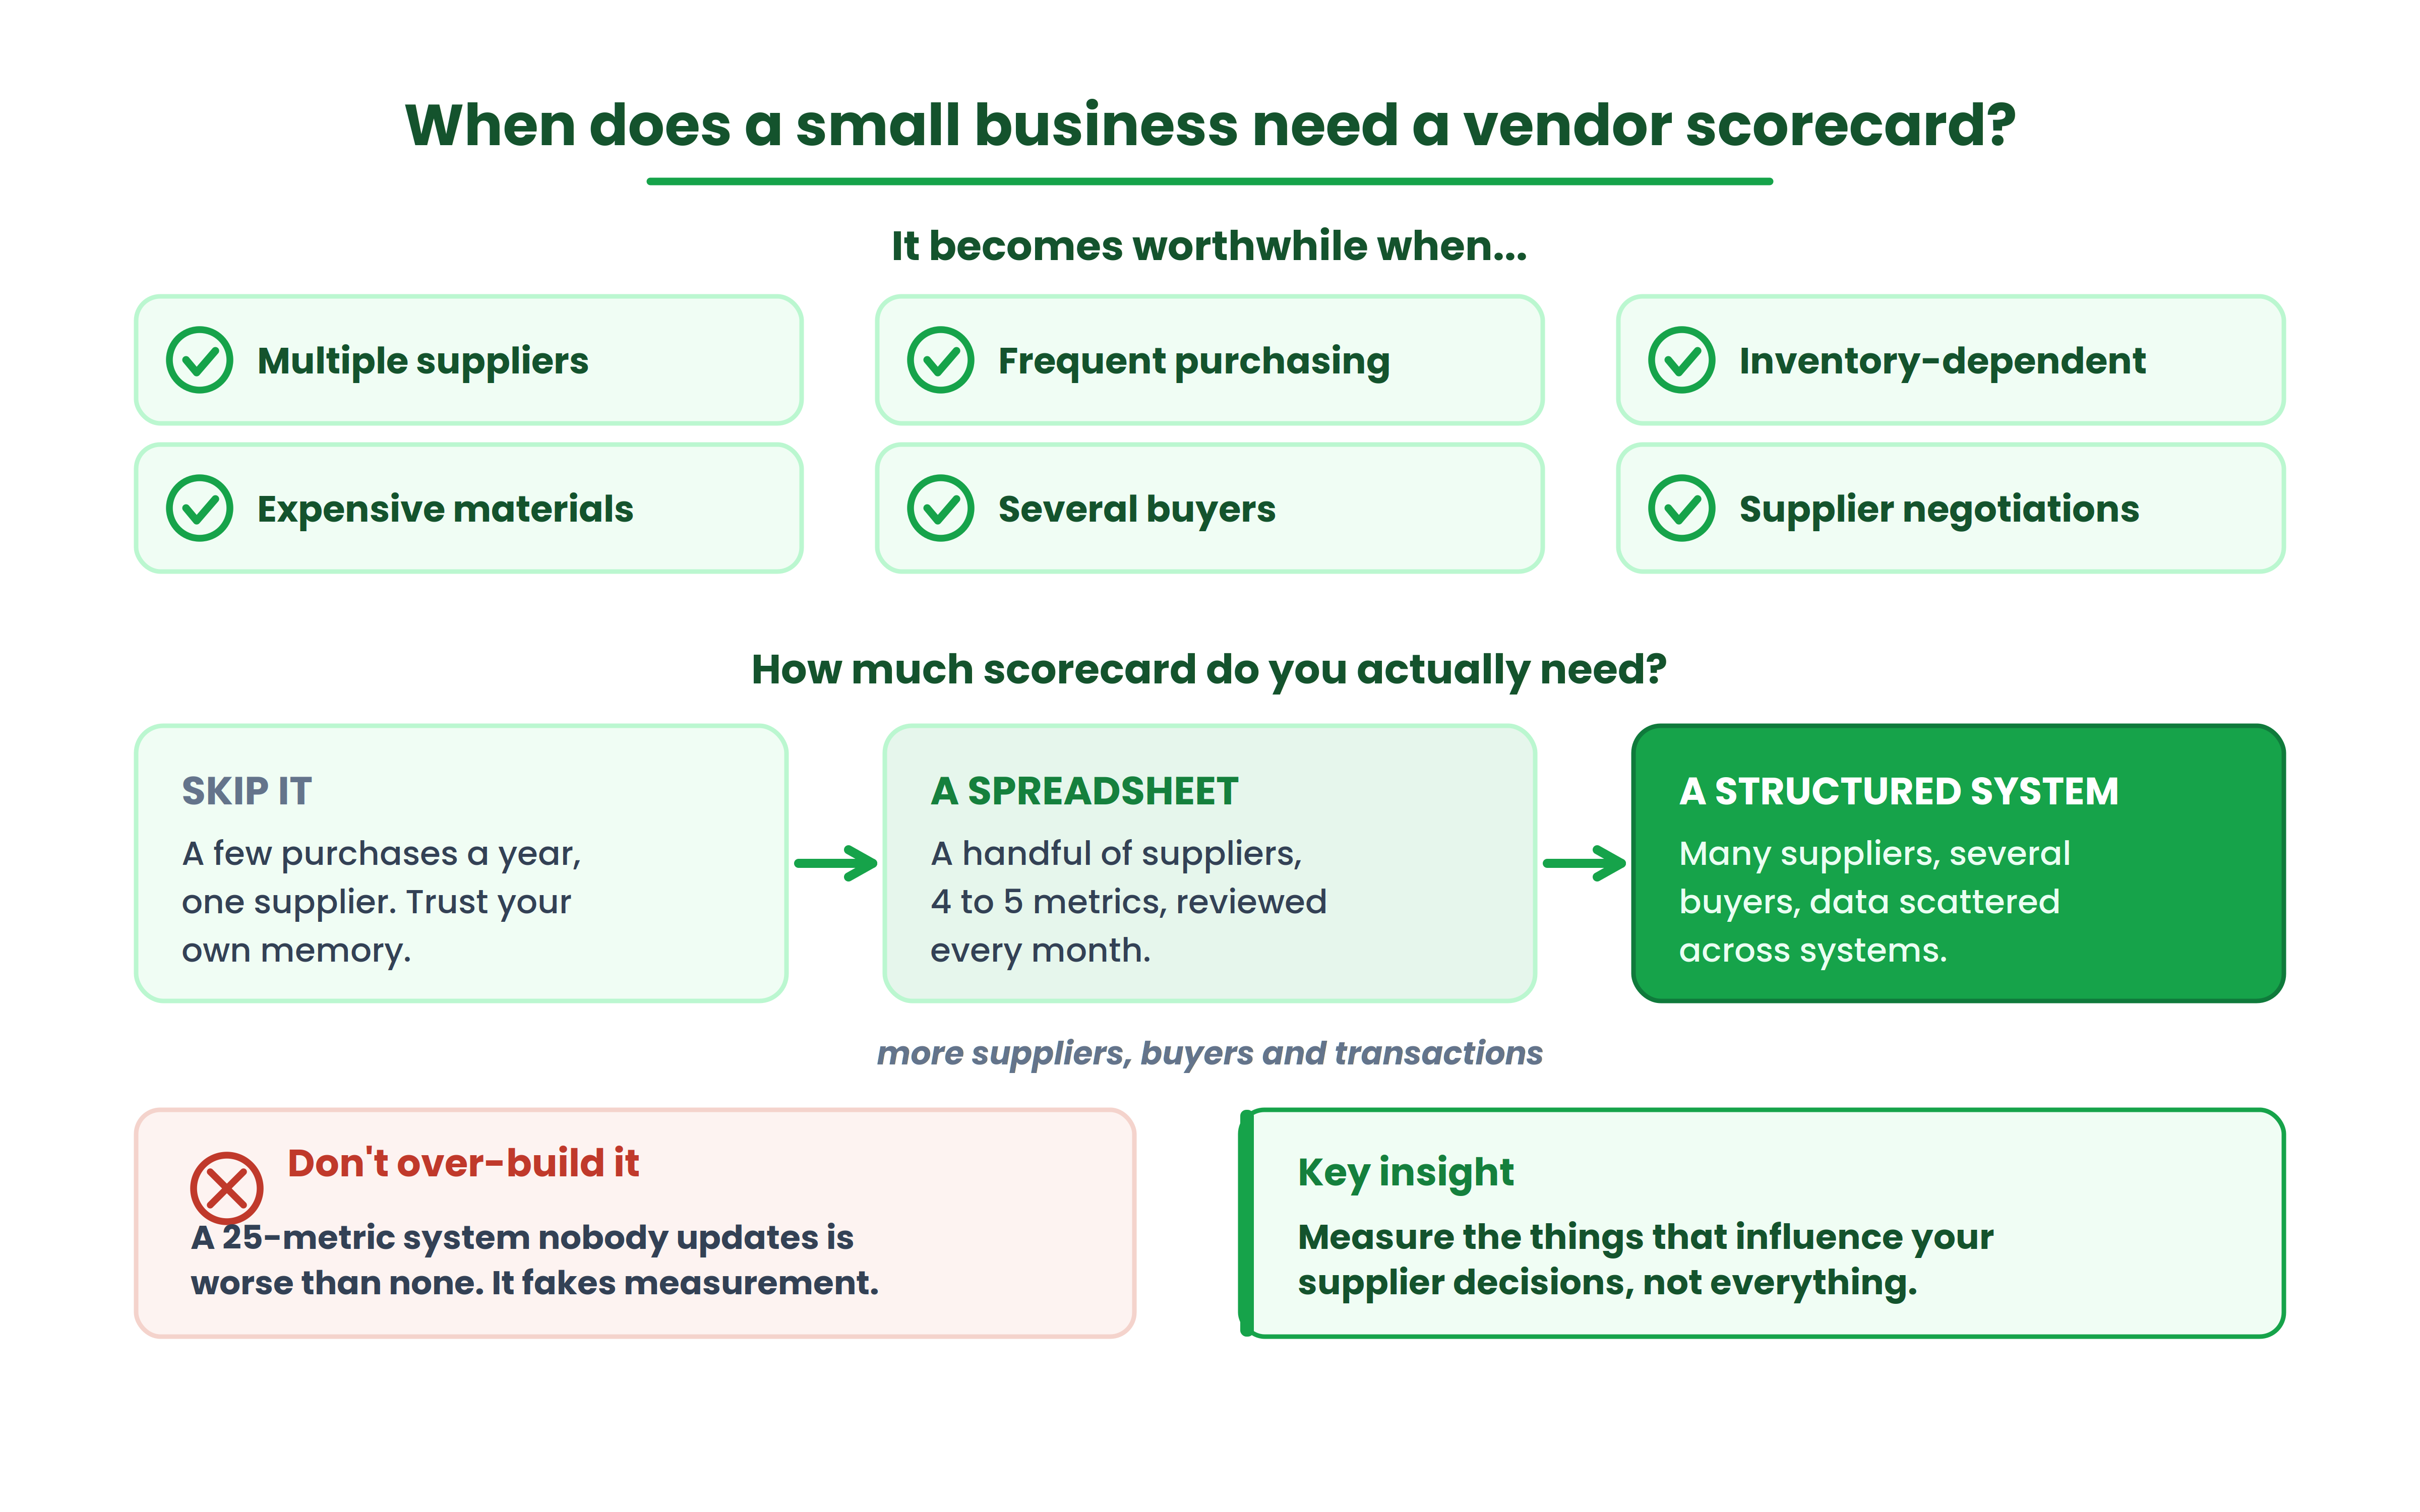
Not every business does. A freelancer buying office supplies twice a year can skip this entirely.
A scorecard becomes worthwhile when you have multiple suppliers for similar items, when purchasing is frequent, when your business depends on inventory, when raw materials are expensive, when more than one person handles purchasing, or when you're heading into supplier negotiations and need evidence.
If you're growing and supplier problems keep showing up as customer complaints or cash tied up in slow-moving stock, that's a signal. For businesses managing inventory across warehouses, supplier measurement stops being optional pretty quickly.
When a simple scorecard is enough
For most small businesses, a spreadsheet is enough. A handful of suppliers, four or five metrics, updated after each review period. If you can track on-time delivery, fill rate, defect rate, and price variance in a single sheet and actually look at it every month, you have a working scorecard. You do not need software to start.
When a more structured system becomes useful
A spreadsheet starts to strain as the number of suppliers, transactions, locations, or purchasing decisions grows. When several people are buying, when the same item comes from more than one source, or when purchasing data is scattered across email and multiple systems, a more structured setup keeps definitions consistent and the data in one place.
What you should not do
Don't build a 25-metric procurement system just because a template exists online. A scorecard nobody updates is worse than no scorecard, because it creates the illusion of measurement.
Key insight: the goal is not to measure everything. It is to measure the things that influence your supplier decisions.
10 metrics to evaluate supplier performance
A useful scorecard measures different dimensions of supplier performance rather than treating price as the entire evaluation. Each metric below follows the same structure: what it measures, the formula, an example, how to read it, why it matters, the data you need, its limitation, and what to compare it against.
1. On-time delivery rate
What it measures: The percentage of deliveries received by the promised date.
Example: 47 out of 50 deliveries arrived on or before the promised date. OTD = 94%.
How to interpret: 94% means roughly one delivery in sixteen slips. Whether that is fine or alarming depends on your buffer stock and lead times: comfortable for a slow-moving item, dangerous for a just-in-time input.
Why it matters: A late supplier can turn into an inventory shortage, which turns into a delayed customer order. A retailer waiting on seasonal stock that arrives two weeks late isn't just inconvenienced; they've lost sales.
Data required: Purchase order promised dates, goods receipt dates.
Limitation: A shipment can arrive on time and still be incomplete. OTD alone doesn't tell you if the full quantity showed up. That's why fill rate exists.
Related metric: Order fill rate, and OTIF (on-time in-full) as the combined measure.
2. Order fill rate
What it measures: The percentage of ordered quantity actually received.
Example: You ordered 1,000 units. 900 arrived. Fill rate = 90%.
How to interpret: A 90% fill rate means one in ten units you were counting on didn't arrive with that order. Read it alongside how quickly the shortfall is backordered, because a 90% fill with a fast top-up is very different from a 90% fill with no follow-through.
Why it matters: Partial shipments break production schedules and create backorders. An ecommerce business that receives 80% of an order can only fulfill 80% of customer demand from that batch.
Data required: Purchase order quantities, goods receipt quantities.
Limitation: Fill rate doesn't capture timing. A supplier could ship the full quantity, just three weeks late. Pair this with OTD. Even better, track OTIF (on-time in-full) as a combined measure, because partial shipments still break production even when they arrive on schedule.
Related metric: On-time delivery rate; together they form OTIF.
3. Defect / rejection rate
What it measures: The proportion of received goods that are defective or non-conforming.
Example: Out of 5,000 units received, 75 failed inspection. Defect rate = 1.5%.
How to interpret: Read the aggregate and the spread. A 1.5% average is healthy for most categories, but check lot-to-lot variation, because a stable 1.5% is a different supplier from one that swings between 0% and 8%.
Why it matters: Each defect creates a chain: return, replacement request, administrative work, potential customer delay. A manufacturer receiving defective components doesn't just lose the component cost; they lose the rework time and possibly the production slot. The lot-to-lot variation matters too. An aggregate defect rate of 1% can hide individual batches that came in at 8%.
Data required: Inspection records, quality notes, units received.
Limitation: Requires consistent inspection. If you only catch defects when customers complain, your defect rate is understated.
Related metric: Return / replacement rate, which captures the downstream consequence.
4. Purchase price variance
What it measures: The difference between the agreed purchase price and the actual invoiced price.
Example: Agreed price: ₹100/unit. Invoice price: ₹104/unit. Variance = +4%.
How to interpret: There is no universal "good" variance. What counts as acceptable depends on the commodity, the contract, market conditions, and your negotiated terms. Track the direction and the consistency, not just a single month.
Why it matters: Small, repeated price creep compresses margins quietly. A distributor seeing 2-3% price variance across hundreds of line items per month is losing real money. This is distinct from formal standard-cost variance used in management accounting; here we're comparing what was agreed on the purchase order against what appeared on the invoice.
Data required: Agreed prices on the purchase order, invoice prices.
Limitation: Doesn't account for market-wide price changes. A commodity supplier raising prices in line with the market isn't the same as one padding invoices.
Related metric: Total supplier cost and agreed-term compliance.
5. Lead-time reliability
What it measures: How consistently a supplier's actual lead time matches their promised lead time.
Example: Supplier promises 14-day lead time. Actual lead times over 10 orders: 13, 15, 14, 21, 14, 16, 14, 14, 22, 15. Two significant outliers.
How to interpret: Look at the spread, not the average. A tight band around the promise is what you want; two 21-day spikes in ten orders is a planning problem even if the mean looks acceptable.
Why it matters: A predictable supplier with a 21-day lead time can be easier to manage than a supplier who promises 10 days but delivers anywhere between 8 and 25. Predictability matters for inventory planning and working capital.
Data required: Promised lead times, actual lead times per order.
Limitation: Averages can hide spikes. Look at variance and outliers, not just the mean.
Related metric: On-time delivery rate, which measures the outcome rather than the consistency.
6. Invoice accuracy
What it measures: The percentage of invoices that match the purchase order and goods receipt without discrepancies.
Example: Out of 40 invoices, 6 had errors (wrong quantities, wrong prices, duplicate charges). Accuracy = 85%.
How to interpret: 85% accuracy means roughly one invoice in seven needs correction. Multiply that by your monthly invoice volume to see the real administrative drag hiding behind the percentage.
Why it matters: Every invoice mismatch costs time. Someone has to identify the error, contact the supplier, get a corrected invoice, and reprocess it. If the 3-way match between PO, receipt, and invoice keeps failing, your AP team is spending hours on problems the supplier created.
Data required: Purchase orders, goods receipts, invoices for the 3-way match.
Limitation: Only captures errors you detect. If nobody checks invoices against POs, accuracy looks perfect on paper.
Related metric: Agreed-term compliance, since many invoice errors are term violations in disguise.
7. Supplier responsiveness
What it measures: How quickly and effectively a supplier acknowledges issues, answers queries, and resolves problems.
Example: Supplier A responds to quality complaints within 4 hours and resolves within 48 hours. Supplier B responds within 24 hours but takes 2 weeks to resolve. Fast replies without resolution aren't responsiveness.
How to interpret: Weight resolution time over reply speed. A quick acknowledgement that leads nowhere is worse than a slightly slower reply that actually closes the issue.
Why it matters: The importance scales with supplier criticality. A service business whose key supplier takes a week to respond to urgent issues is passing that delay straight to clients.
Data required: Communication and support logs, issue tickets, timestamps on queries and resolutions.
Limitation: This is harder to quantify than delivery or quality. Track issue resolution time and closure rate rather than just reply speed.
Related metric: Return / replacement rate, since responsiveness is what contains the damage when goods go back.
8. Return / replacement rate
What it measures: The percentage of purchases resulting in returns, replacements, or supplier credits.
Example: 8 out of 200 orders required returns or replacements. Rate = 4%.
How to interpret: Read this next to defect rate. If returns run well above defects, the extra returns are coming from shipping damage, wrong items, or ordering errors, not just quality at receipt.
Why it matters: Returns generate reverse logistics costs, administrative effort, and potential stockouts while waiting for replacements.
Data required: Returns records, replacement requests, supplier credit notes.
Limitation: Overlaps with defect rate but isn't identical. Defect rate measures quality at receipt. Return rate captures the broader set of reasons goods go back, including shipping damage and wrong items.
Related metric: Defect / rejection rate, its upstream cause.
9. Agreed-term compliance
What it measures: Whether the supplier adheres to contractually agreed prices, discounts, payment terms, quantities, freight terms, and service levels.
Example: Supplier agreed to 30-day payment terms and free freight above ₹50,000. They start charging freight on qualifying orders. That's a compliance failure.
How to interpret: A supplier can score well on delivery and quality while quietly drifting off the agreed commercial terms. Track compliance separately so those violations don't get averaged away.
Why it matters: Contract compliance dropped as soon as off-contract substitutions started, according to procurement teams who track this metric. SLA compliance is the simplest way to measure service discipline.
Data required: Documented agreements, purchase orders, invoices.
Limitation: Requires clear, documented agreements. If your terms live in email threads rather than purchase orders, compliance becomes hard to measure.
Related metric: Purchase price variance and invoice accuracy.
10. Total supplier cost
What it measures: The true cost of buying from a supplier, beyond the unit price.
Components: Purchase price + freight + handling + defect-related costs + returns + rework + emergency purchases caused by supplier failures + administrative effort resolving issues.
Example: Supplier A charges ₹95/unit. Supplier B charges ₹100/unit. But Supplier A's defect rate generates ₹3/unit in rework, and their late deliveries triggered two emergency air shipments last quarter. The cheapest unit price still loses once TCO includes freight, rework, and downtime.
How to interpret: The cheapest supplier isn't necessarily the cheapest supplier to work with. Use total supplier cost for comparison and negotiation, not as a bookkeeping entry.
Why it matters: Comparing only invoice prices can produce a misleading conclusion. Total supplier cost is where hidden costs from every other metric finally show up in one number.
Data required: Multiple sources: invoices, freight and handling records, defect and return costs, emergency purchase records.
Limitation: TCO is a decision-making concept, not a formal accounting entry. Don't dump every consequence into your inventory cost on the books. Use it for supplier comparison and negotiation.
Every metric here starts with clean purchasing data
ProfitBooks keeps vendor records, purchase orders, purchase bills, and payments in one place, so the delivery dates, quantities, prices, and returns behind these ten metrics stay matched to the right supplier.
Vendor scorecard metrics at a glance
The ten metrics, the dimension each one captures, and where the data usually lives.
| # | Metric | What it measures | Typical data source |
|---|---|---|---|
| 1 | On-time delivery rate | Delivery reliability | Purchase/delivery records |
| 2 | Order fill rate | Completeness | Purchase records |
| 3 | Defect rate | Quality | Inspection/return records |
| 4 | Purchase price variance | Price consistency | PO/invoice |
| 5 | Lead-time reliability | Predictability | PO/delivery |
| 6 | Invoice accuracy | Billing accuracy | Bills/invoices |
| 7 | Responsiveness | Service | Communication records |
| 8 | Return/replacement rate | Downstream quality issues | Returns/credits |
| 9 | Term compliance | Agreement adherence | PO/contracts/invoices |
| 10 | Total supplier cost | Broader cost | Multiple sources |
How should you weight vendor scorecard metrics?
Not all metrics deserve equal weight. A manufacturer buying precision components will weight quality and delivery far above responsiveness. A retailer sourcing commodity goods might weight cost and availability higher.
Example of a weighted scorecard
Group the ten metrics into four categories and assign each category a weight. The category scores then roll up into a single weighted number.
| Category | Illustrative weight |
|---|---|
| Quality (defect rate, returns) | 30% |
| Delivery (OTD, fill rate, lead-time reliability) | 30% |
| Cost (price variance, TCO) | 25% |
| Service (responsiveness, invoice accuracy, compliance) | 15% |
These weights are illustrative. They are not universal benchmarks. Adjust them to your supplier category and business priorities.
Why different suppliers need different weights
The same weighting shouldn't apply to every supplier. For a manufacturing or raw-material supplier, quality and delivery usually dominate. For a commodity supplier, price carries more weight. For a service provider, responsiveness and reliability matter more than unit cost. For a critical supplier, continuity and reliability may outweigh everything else. Weight the metrics that actually change your decision for that supplier.
The 4P supplier scorecard: a practical framework
The 4P Supplier Scorecard is a ProfitBooks editorial framework, not an industry-standard methodology. It groups the ten metrics into four questions:
1. Price
Are supplier costs aligned with what was agreed? (Purchase price variance, total supplier cost)
2. Product
Are quality and quantities correct? (Defect rate, fill rate, return/replacement rate)
3. Promise
Does the supplier deliver when promised? (On-time delivery, lead-time reliability, agreed-term compliance)
4. Partnership
How effectively does the supplier communicate and resolve problems? (Responsiveness, invoice accuracy)
Worked example: comparing three suppliers
Illustrative example, not an industry benchmark.
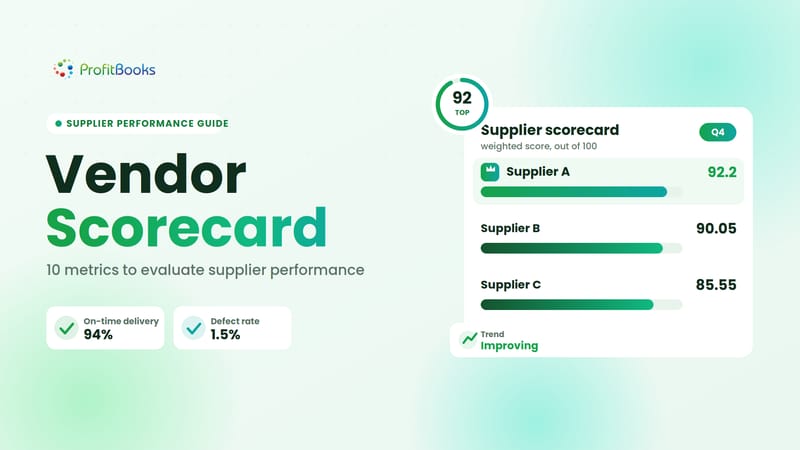
| Metric | Weight | Supplier A | Supplier B | Supplier C |
|---|---|---|---|---|
| Delivery | 30% | 90 | 96 | 82 |
| Quality | 30% | 95 | 82 | 98 |
| Cost | 25% | 98 | 90 | 78 |
| Responsiveness | 15% | 80 | 95 | 85 |
| Weighted score | 100% | 92.2 | 90.05 | 85.55 |
Weighted scores: A = 92.2, B = 90.05, C = 85.55.
What the numbers tell you
Supplier A scores highest overall. But Supplier B's delivery performance is strongest, and their responsiveness is far ahead. If your business depends on tight delivery windows, B might be the better choice despite a lower total score. Supplier C has the best quality but the weakest cost performance. I would not pick a supplier based on the composite number alone.
The score gives you a structured basis for discussion, not a verdict. The final decision also depends on how critical the supplier is, what it would cost to switch, what alternatives exist, whether they have the capacity you need, and where your business priorities sit right now.
Why the highest vendor score isn't always the right decision
A scorecard supports a decision; it doesn't make it. The supplier with the highest composite number is not automatically the one you should keep, expand, or switch to. Several factors sit outside the score entirely.
Before you act on a score, weigh the things it doesn't capture:
- Switching cost, and how disruptive a change would be
- Whether an alternative supplier is even qualified for your requirements
- Availability of real alternatives and geographic dependency
- Capacity, and whether the higher-scoring supplier can actually take your volume
- Existing contract commitments
- Business criticality of the item being supplied
- Improvement trajectory: a lower score that is climbing may beat a higher score that is slipping
- Supply continuity and the risk of disruption
Key insight: a score tells you what happened. It does not, by itself, tell you what decision to make.
Why supplier trends matter more than one score
One score is a snapshot. Several periods reveal direction.
| Supplier | Q1 | Q2 | Q3 | Q4 |
|---|---|---|---|---|
| Supplier A (improving) | 84 | 87 | 90 | 92 |
| Supplier B (declining) | 94 | 92 | 88 | 82 |
Supplier B still scored higher than A in Q4. But the trajectory matters. A vendor that "looks good" in a monthly review can hide deterioration if you're only checking snapshots. Track rolling 30/90-day trends instead.
Key insight: supplier performance should be evaluated as a pattern, not just a snapshot.
How supplier type changes your scorecard
The metrics that matter most shift with the kind of supplier you're measuring. These are examples of considerations, not universal weighting rules.
| Supplier type | Metrics that may matter more |
|---|---|
| Manufacturer / raw-material supplier | Quality, delivery, fill rate |
| Distributor | Availability, fill rate, delivery |
| Commodity supplier | Price, delivery, terms |
| Service provider | Responsiveness, reliability, service quality |
| Critical supplier | Continuity, lead time, reliability |
| Ecommerce supplier | Fill rate, returns, delivery |
Where does the data for a vendor scorecard come from?
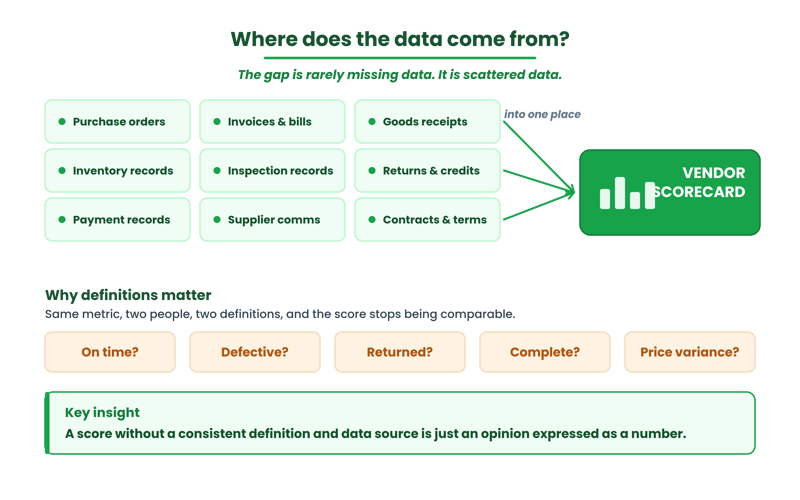
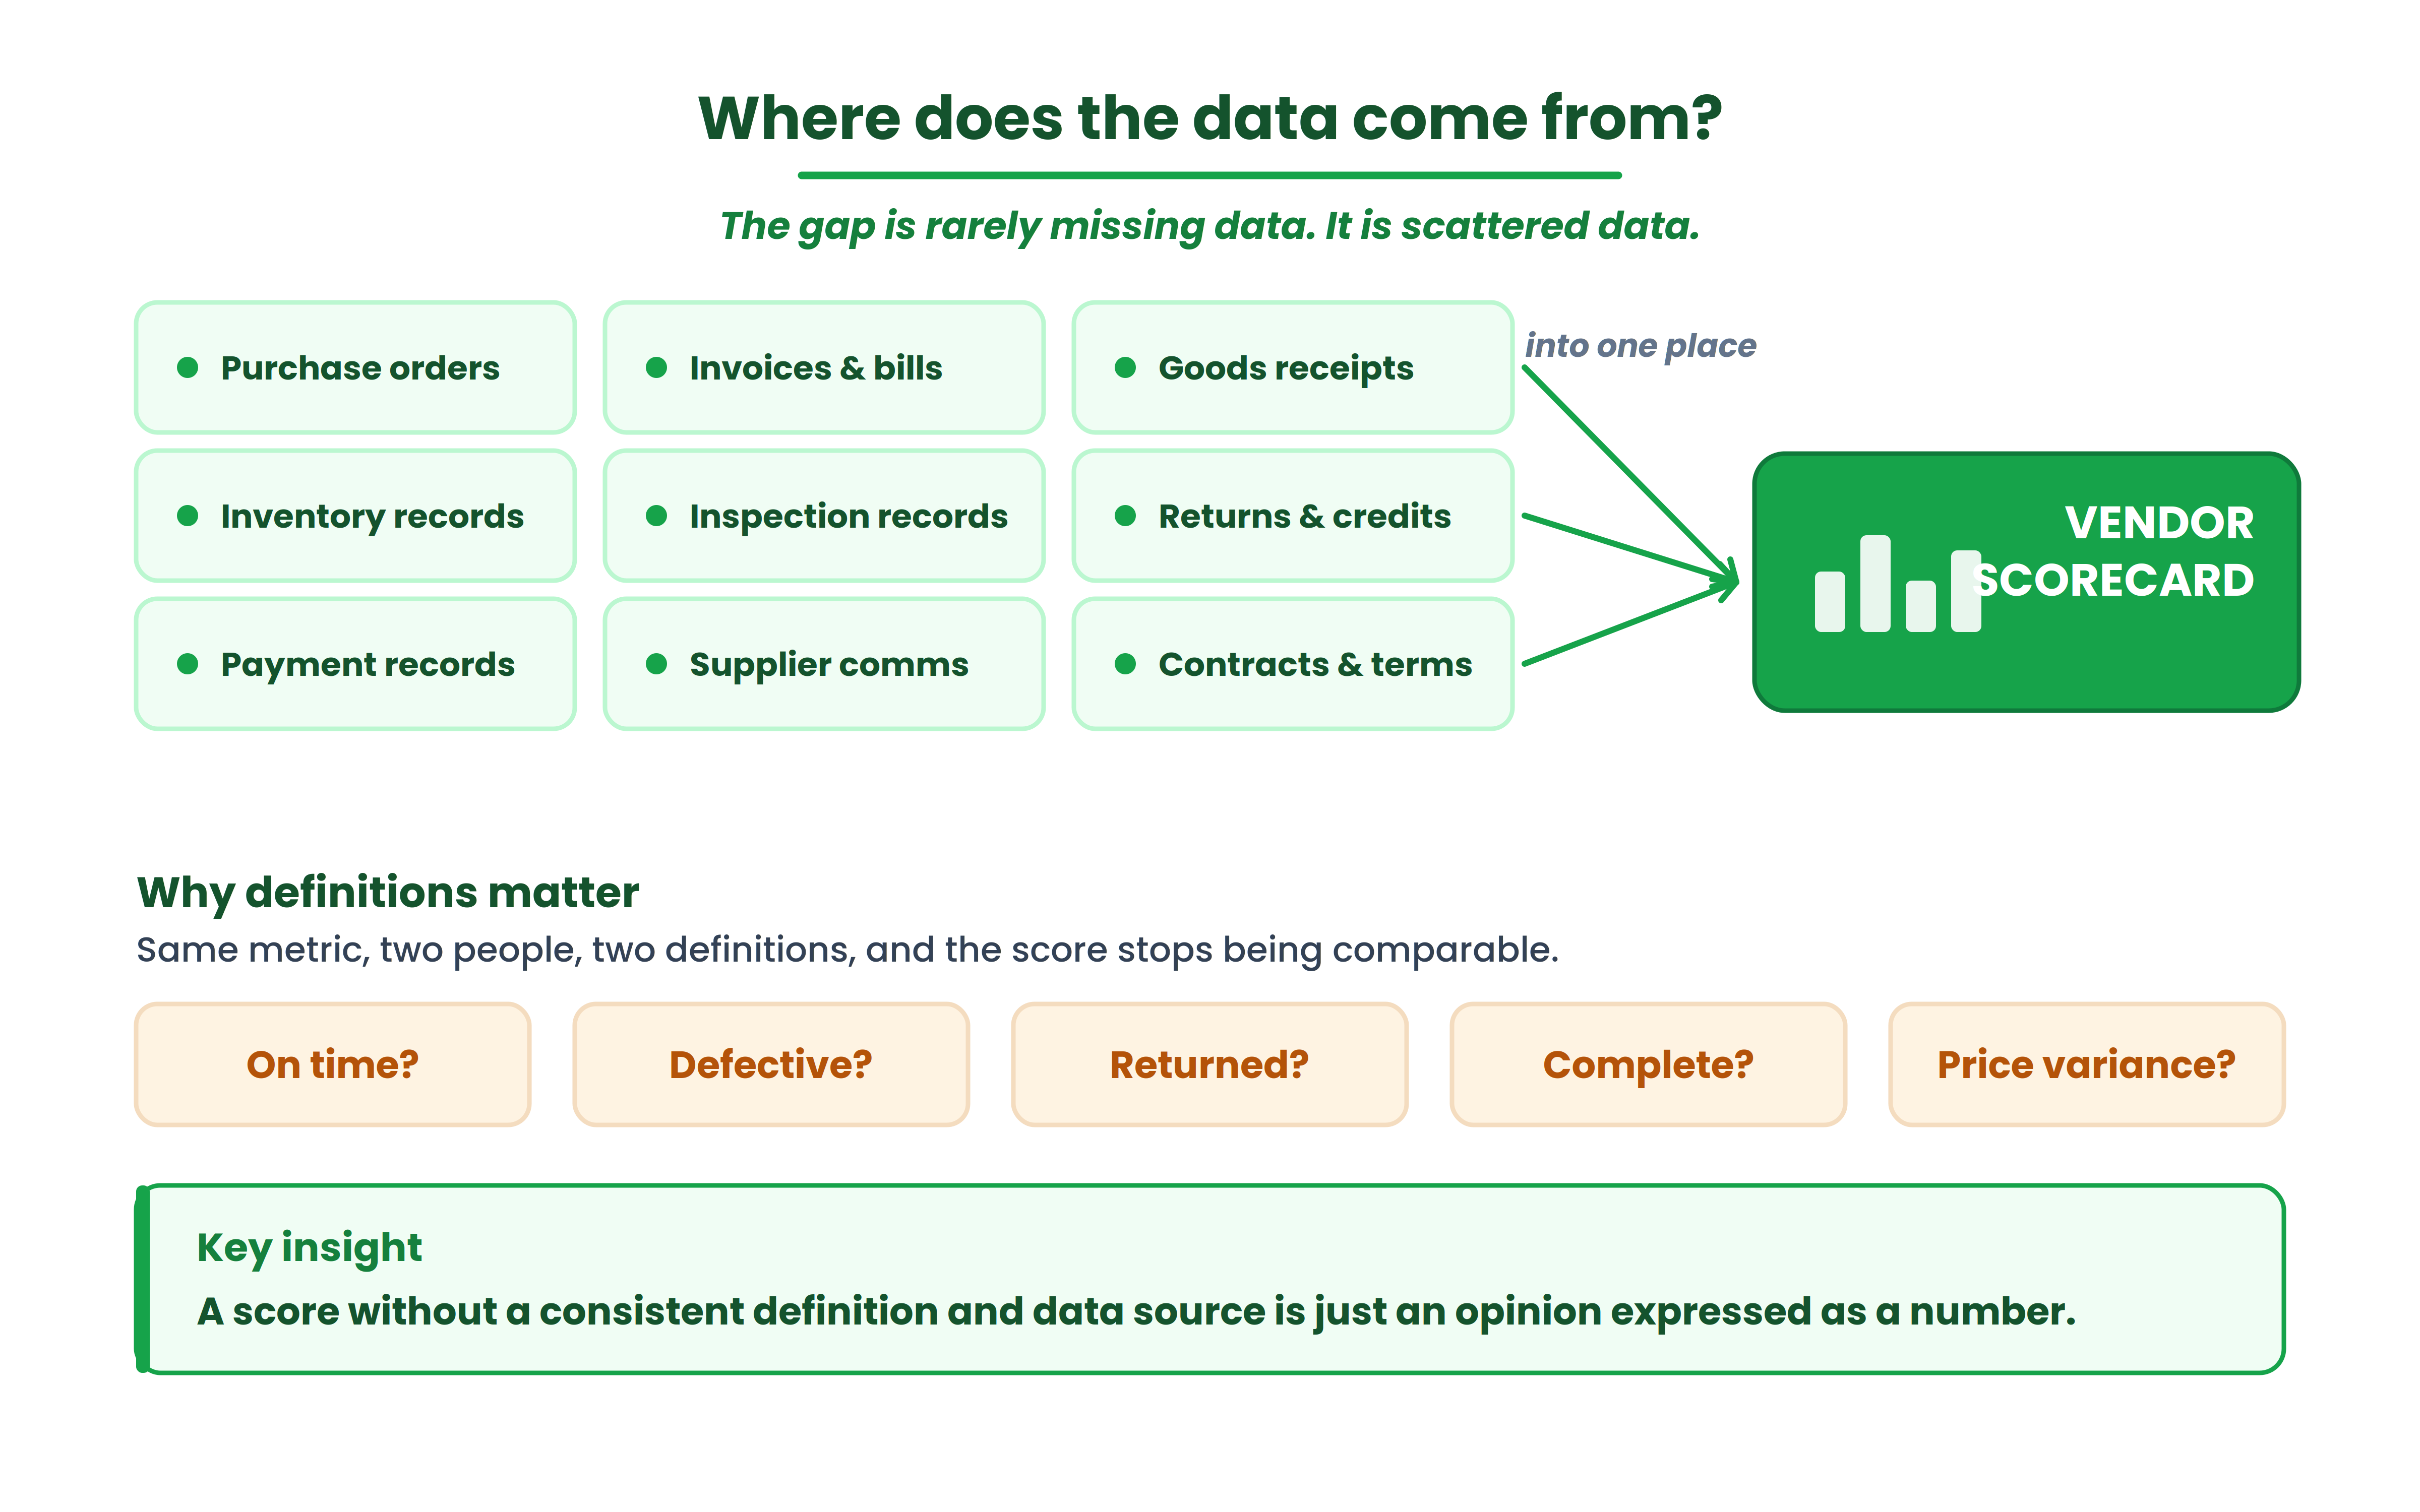
Every metric above requires data that already exists in most purchasing workflows: purchase order dates and quantities, goods receipt records, inspection or quality notes, invoices, and payment records. The gap is usually not missing data but scattered data, split across spreadsheets, email, and accounting software.
In practice, the data comes from:
- Purchase orders
- Purchase invoices and bills
- Goods receipts
- Inventory records
- Inspection records
- Returns and credit notes
- Payment records
- Supplier communications
- Contracts and agreed terms
Why data definitions matter
A metric is only as reliable as its definition. What exactly counts as on time? As defective? As returned? As complete? As a price variance? If two employees calculate the same metric differently, the scorecard stops being comparable across suppliers or across periods.
Key insight: a score without a consistent definition and data source is just an opinion expressed as a number.
 Common vendor scorecard mistakes
Tracking 20+ KPIs and updating none of them consistently. Using the same weights for a raw-material supplier and an office-supply vendor. Scoring "responsiveness" based on feelings rather than resolution times. Changing how you define "on time" between reviews. Measuring only price. Ignoring partial deliveries. Building the scorecard and never assigning thresholds, owners, or corrective actions. That last one is the most common failure mode.
1. Tracking too many metrics
A 20-KPI scorecard looks thorough but never gets updated. Start with four or five metrics you will actually maintain.
2. Giving every metric the same weight
Equal weights treat a defect and a slow email reply as the same problem. Weight by what changes your decision for that supplier.
3. Using subjective scores
"Responsiveness: 7/10" based on a feeling isn't measurement. Base it on resolution time and closure rate.
4. Changing definitions midway
Redefining "on time" between reviews breaks comparability. Lock the definitions before you start scoring.
5. Measuring price but ignoring total cost
The lowest invoice price often hides freight, rework, and emergency purchases. Compare on total supplier cost.
6. Ignoring partial deliveries
On-time but short still breaks production. Track fill rate alongside delivery, or use OTIF.
7. Ignoring quality-related costs
Defects don't stop at the reject bin. Count rework, returns, and the delays they cause.
8. Looking at only one period
A single month can flatter a declining supplier. Read the trend across quarters, not the latest snapshot.
9. Creating scores without taking action
A score with no threshold, owner, or corrective action is just a number in a file. Attach an action to every result.
10. Comparing suppliers with completely different roles
Scoring a raw-material supplier and an office-supply vendor on the same card compares things that aren't alike. Match the scorecard to the supplier's role.
| Myth | Reality |
|---|---|
| Lowest price means best supplier | Total cost matters |
| On-time delivery is enough | Completeness and quality matter too |
| Every supplier needs the same scorecard | Weighting should reflect supplier role |
| More KPIs are better | Too many makes the scorecard unusable |
| One score tells the whole story | Trends and underlying KPIs matter |
What should you do when a supplier scores poorly?
A scorecard supports a decision; it doesn't make the decision. Consider switching costs, alternative availability, product criticality, and whether the supplier is improving.
Strong, stable performance
Continue and monitor. Keep the review cadence, but don't create work where there isn't a problem.
Mixed performance
Identify the specific weak metrics and agree on corrective action with clear timelines and a review period.
Persistent underperformance
Escalate, renegotiate, or begin qualifying alternatives. Consider switching where it is justified.
Key insight: there is no universal score threshold for replacing a supplier. The right cutoff depends on criticality, alternatives, and switching cost, not a fixed number.
Vendor scorecard template
A reusable structure you can drop into a spreadsheet. Fill it out per supplier, per review period.
| Supplier | KPI | Target | Actual | Score | Weight | Weighted score | Action |
|---|---|---|---|---|---|---|---|
| Supplier A | On-time delivery | 95% | 91% | 91 | 30% | 27.3 | Review carrier performance |
| Supplier A | Defect rate | <2% | 3.1% | 69 | 30% | 20.7 | Request corrective action |
Fill this out per supplier, per review period. The "Action" column is the most important one. A supplier scorecard is useful only when every KPI has a defined calculation, a reliable data source, a review period, and an action associated with the result.
What to review monthly
Delivery, quality, pricing, invoices, and responsiveness. These are the operational metrics that move week to week and where problems need catching early. Treat this cadence as a practical example, not a universal standard.
What to review quarterly
The overall trend, recurring problems, supplier concentration, commercial terms, and improvement trajectory. Quarterly is where you step back from individual deliveries and look at direction. Again, adjust the frequency to your business rather than treating it as a rule.
How ProfitBooks can help keep your vendor data organized
A scorecard is only as useful as the data behind it, and for most businesses the hard part isn't the formulas, it's keeping purchasing and vendor information in one place so the numbers are easy to calculate and review.
ProfitBooks keeps the underlying records a scorecard draws on in one system: vendor records, purchase orders, purchase transactions and bills, payment information, accounts payable, and vendor statements, along with inventory-related records and reports. When purchase order dates and quantities, receipts, invoice prices, and payments live together instead of scattered across spreadsheets and email, calculating on-time delivery, fill rate, price variance, and invoice accuracy becomes far less painful, and the reporting gives you a consistent view to review each period.
To be clear about scope: ProfitBooks organizes the purchasing and vendor data behind these metrics. It does not automatically generate vendor scorecards, predict supplier performance, or calculate these ratios for you. What it gives you is clean, connected source data, which is the part most businesses actually get stuck on.
Keep your vendor and purchase data in one place
The metrics above depend on clean purchasing records. ProfitBooks supports vendor records, purchase orders, purchase bills, and payment tracking, giving you the underlying data a scorecard needs.
Final takeaway: a vendor scorecard should improve decisions, not just produce a number
The purpose of a vendor scorecard isn't to give every supplier a number. It is to help a business understand where supplier performance is affecting cost, inventory, operations, and customer service, and then to do something about it.
If you take one thing from this guide, make it the discipline behind the score:
- Measure multiple dimensions, not just price
- Define each metric consistently
- Use weights that fit the supplier and your priorities
- Track trends, not single snapshots
- Consider supplier context before acting
- Connect every score to an action
The next problem you'll hit isn't choosing the right metrics. It's maintaining the discipline to collect the data, review it quarterly, and actually have the conversation with suppliers when scores slip. Start with your top three suppliers and four metrics. Expand once the habit sticks. The value of a scorecard isn't the score. It's the decision that follows it.